Understanding Products Through Storytelling
The construction of stories is a powerful technique in data-informed product building. Stories help us deeply understand any phenomenon, such as changes in revenue, and identify drivers. In this document, we will discuss how to build great products using the power of storytelling.
Team Sequoia India & Southeast Asia (now known as Peak XV)
Published March 8, 2020

INTRODUCTION
2.4 billion! If you heard this number and nothing else, you would probably assume that something big was being discussed. Revenue or population, perhaps. The number by itself does not say much. You need more information.
Suppose you were told that 2.4 billion was the number of Facebook’s monthly active users (MAU) in Q1 2019. With this additional context, you are able to imagine more, and to ask more questions. How fast are Facebook’s users growing? What is the MAU for other social products, such as Gmail and Snapchat? What, in fact, does 2.4 billion MAU actually mean? The moment there is a metric, we can begin to make sense of a number.
This happens in every part of our lives. You have just arrived at the workplace at 8:00 a.m. The workplace is buzzing with activity. You observe a couple of employees already at work. You watch other people walking into the office. You observe the colors and types of dress that people are wearing, listen to the sounds of people chatting away, the sound of a phone ringing in the background. The smell of fresh donuts drifts past. This information helps you construct the world around you. You continuously fill many pieces of information subconsciously. You smell donuts: you expect that breakfast is likely being served. One of the employees who is usually at work early is not here yet: you wonder if they got sick. Maybe some virus is going around. We stitch together these pieces of information into a story that makes sense. We constantly reject stories that do not make sense and favor narratives that are logical to us.
Data is either quantitative or qualitative. We stitch together these data points together to turn them into a logical, cohesive, step-by-step narrative that helps us with decision making. The construction of stories, therefore, is a powerful technique in data-informed product building. This story helps us deeply understand what is going on with a product as we determine its goals, roadmap, and strategy. Stories help us deeply understand any phenomenon, such as changes in revenue, and identify drivers. In this document, we will discuss how to build great products using the power of storytelling.
TELLING A PRODUCT’S STORY
So how does storytelling help us look at data and metrics and actually understand if a product is doing well? As a case study, let’s examine a smartphone application that collects users’ photos from different channels and uses them to share memories.
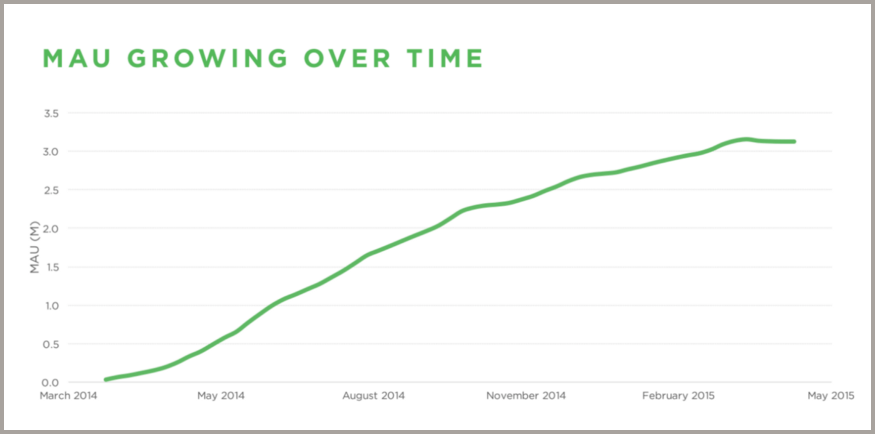
Let’s start with one piece of information: the app’s monthly active users on Android devices in the U.S. from March 2014 to May 2015. Figure 1 tells us that the app’s number of active users has grown during this period. As of May 2015, the app has about 3 million monthly active users, which, on the face of it, seems reasonably good for this category of app. However, Figure 1 also shows us that user growth has plateaued. Without additional information, it is hard to know if the product is doing well.
Additionally, suppose we also know the ratio of daily to monthly active users (DAU/MAU). This helps us refine our story. According to Figure 2, DAU/MAU hovers around 70%, which means that, on average, people engage with the product roughly 21 days out of every month. This is an excellent engagement rate shared by very few products. In fact, it is in the ballpark of the DAU/MAU ratios of WhatsApp and Facebook.
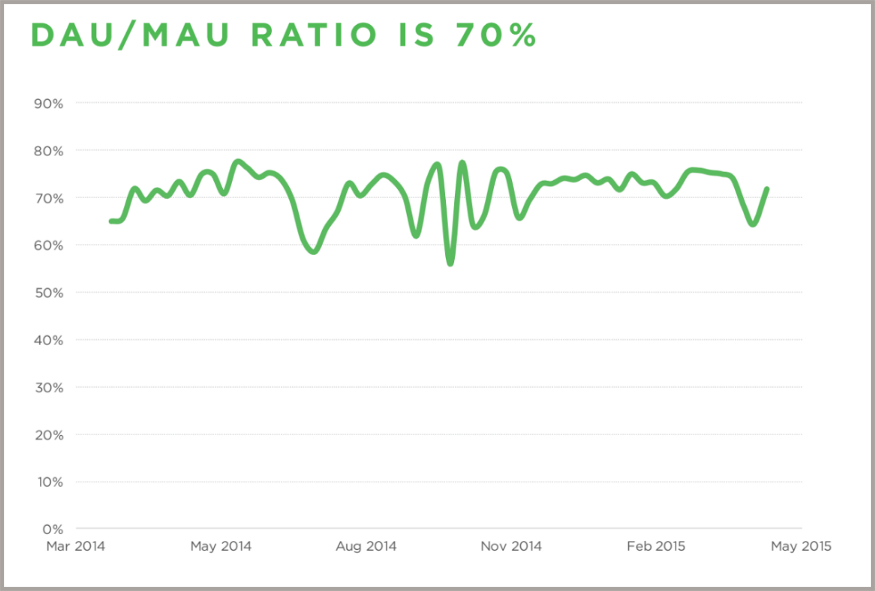
After looking at just two metrics, this product’s story so far appears to be a good one: 3 million people use this product almost every day. With such a high DAU/MAU ratio, we can infer that the daily retention must also be very high for this product.
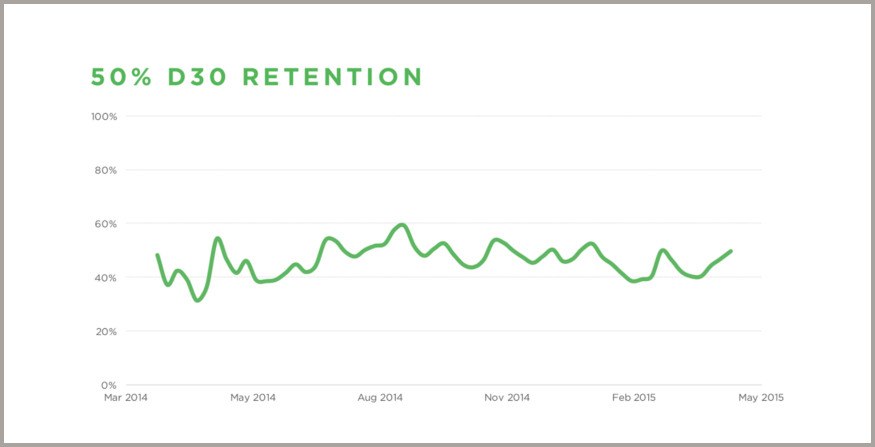
We can verify this assertion by plotting the product’s 30-day (D30) retention rate, which shows what percentage of users are continuing to engage with the product 30 days after they first started using it. Figure 3 shows that the product’s D30 retention is fairly stable and comes in high at 50%, consistent with the product’s high DAU/MAU ratio. As short-term retention has stayed relatively constant, we can deduce that the slowdown of growth we saw in Figure 1 is not due to a reduction in short-term retention rates. We still have little idea on why the product is retaining so well. If the product is doing great, why, then, has growth slowed?
Let’s see how often people are opening the app once the product has been installed. If a large percentage of people are opening the product, this indicates that people find value in the product. Figure 4 shows that the app’s open rate was extraordinarily high in March 2014, at nearly 90%. By May 2015, the app’s open rate declined to a little over 75%. Despite this decline, an open rate of more than 75% is comparable to some of the best apps.

If we reconstruct the story now, we have a product that is being used by 3 million people nearly every day, with a strong short-term retention rate and a lower but still excellent open rate. The story is still a good one.
We know that the product is being opened each day, but we don’t know what drives users to open the app, how frequently within each day they open it, or how much time they spend on the product. Understanding this will help us construct a better picture of what is going on with the product.
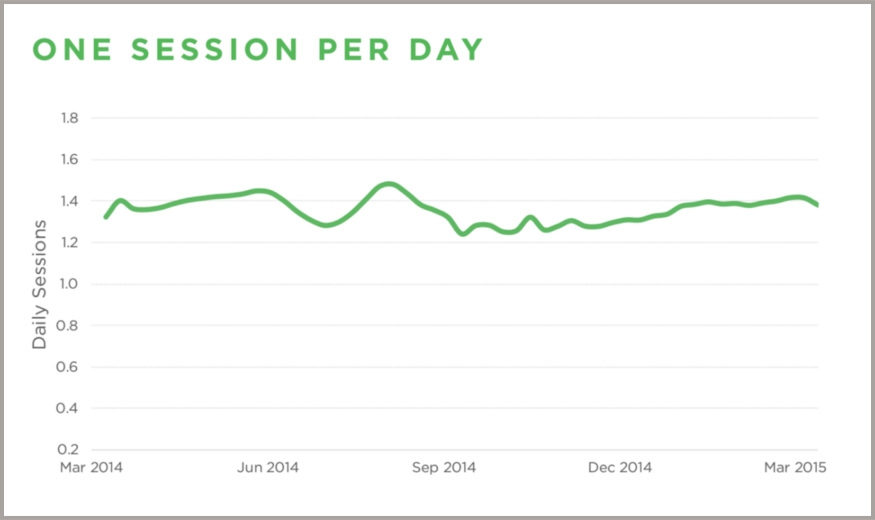
To continue filling in the blanks of our story, let’s look at the number of sessions that users have per day. Figure 5 shows that sessions per day is roughly constant around 1.4, indicating that most people are coming to the product once a day, some twice. This is interesting, because now we know that 3 million people come to this product almost every day, but most of them come just once a day.
Moreover, Figure 6 tells us that the product is being used only for about one minute per day. Why would people come just once a day, for one minute, but return to the product every day? Do they truly love the product and voluntarily come to the product each day? If so, why spend just a minute in one session.
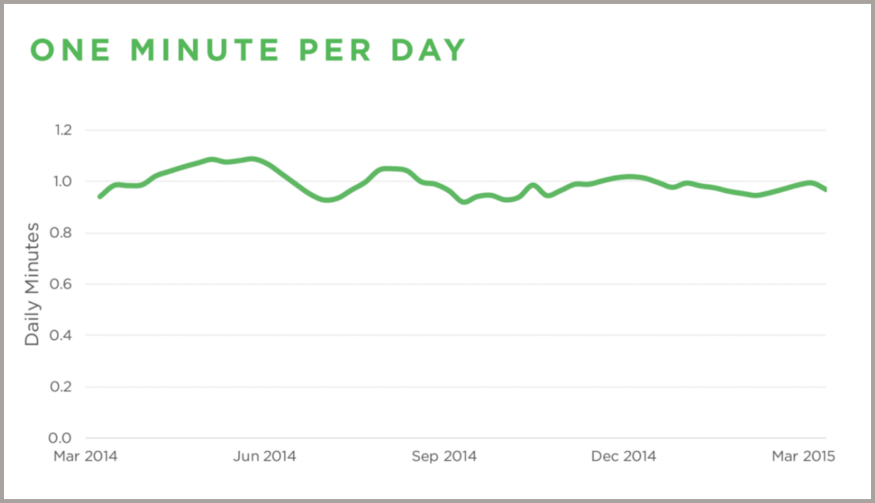
Let’s reconstruct the story again. We now have a product that a lot of people like enough to open nearly every day, but they spend just one minute on one session using the product. Usually, the apps that people use every day are the ones they use more than once or day, or use for longer than just one minute, so this story is somewhat puzzling.
We can narrow down the probable causes by investigating what brings users to the product each day. In all likelihood, it was a notification. People see the notification on their phone, click on it, look at a photo from the past, maybe they share it on Instagram, and then they go back to whatever they were doing. This process takes about a minute. They don’t have multiple sessions because the product sends them just one notification and shares just one photo each day. This is the most likely story.
Our fully reconstructed story is that our product is a healthy one, with 3 million users who are driven by a notification to open the app once a day, every day, for one minute. The product’s high D30 retention rate and open rate shows that the app does add value for its users. Clearly, there is a product-market fit that this product is filling in a strong way. Constructing this product narrative helps us understand the product better and allows us to make better decisions.
We could use this same process to construct a story that explains why the product’s user growth slowed down. We already know that it is not due to a reduction in retention among newer cohorts. If we employ the growth accounting framework and perform root cause analysis, we would be able to discover the driver to be either slowdown in new user growth and/or decreased resurrection. We’ll stop here, but by calculating these terms, we could come up with a hypothesis on what is driving this product’s user growth slowdown.
There are many other products whose use is predominantly driven by notifications. Alarm clocks, pill reminders, daily to-do lists and weather apps are all examples, and they tend to have high DAU/MAU ratios, a low number of sessions, low time spent, high retention and high open rates.

Now that we’ve walked through a case study of telling a product’s story with metrics, we’ll outline tactical steps on how to use metrics to construct a helpful story for any product.
STEPS FOR CONSTRUCTING A STORY
- Start with the primary question. Your primary question should address what you want to understand. Are you trying to figure out whether a new app will have a product-market fit, as we did in the previous case study? Or are you trying to understand unit economics or something else? Whatever you want to understand should drive your primary question.
- Hypothesize and construct an initial story using a few key metrics to answer the primary question. Each product has a set of metrics that connect together to tell a compelling story. Many of these metrics are strongly correlated with each other; are not statistically independent and do not provide that much additive value. For example, retention and downloads are orthogonal, whereas DAU and WAU are correlated, not orthogonal. It is valuable to identify key orthogonal metrics that matter the most. These metrics can help tell a compelling story that answers your primary question. Identify these metrics and start probing the story they tell.
- Use benchmarking to quantify performance. To understand whether a product is performing well, comparable metrics are needed. These should be apples-to-apples comparisons; for example, the key metrics for a social messaging product should be compared to key metrics for similar products in the same space. Without benchmarking, it’s difficult to tell if things are going well or not.
- Stress test the story.
- Look for consistency and incongruence. A story that makes sense has to consistent. For example, it is impossible to have a consistently high DAU/MAU ratio and also have consistently very low retention. If you see something incongruous like that, there might be bad data or an edge case that you need to understand. The example of an edge case is where recent cohorts have lower retention rates but older cohorts have high retention. Any time the data do not fit the story, either the story is wrong, or the data is wrong. If the story is wrong, one needs to modify the story.
- Identify counter metrics that will likely disconfirm the assumptions of your story. For example, you may initially identify that revenue is increasing with the number of users and construct a story that people are spending more over time. Upon further investigation, you may realize that one outlier spender was the driver of this shift. In this case, the revenue concentration metric would be a good metric to check. You’ll need to change your story, and the implications it will have for the direction of your product will change too.
- Examine complementary metrics to triangulate your story. L5+/L7 describes the percentage of people that use a product more than five days of the week. If this metric is high, then DAU/WAU should be high and vice versa. Triangulate your story by looking at adjacent metrics.
- Iterate and modify the story until all the data fits. Repeat steps 2 through 5 until all of the data makes sense in a story. Hypothesize about what may be going on and look at the right metrics and data. Then examine additional data to generate more hypotheses. Iterate between the two approaches until the story makes sense and you are able to answer the question at hand.
- Hypothesize alternate stories. In cases where there is not enough data to determine the complete narrative, identify the different story scenarios and pathways to confirm or invalidate each possible story. A perfect story is not absolutely necessary to make decisions. In fact, it is almost impossible to construct a bullet-proof story, and the last-mile problem (the last 10 % of the story will likely take multiple times the effort than the first 90%) can make constructing the perfect story prohibitively expensive. As a result, it’s important to identify a threshold for being comfortable making decisions when most of the story is clear, but not all of it.
WHY CONSTRUCTING STORIES MATTERS
The story itself matters, and so does the process of constructing it. The benefits of constructing a story include:
- A holistic understanding of the phenomena at play. One or two metrics can’t tell a complete story. Too often, we have seen product people choose one or two favored metrics and make decisions based on the limited, partial story those metrics tell. For example, metrics of 3 million MAU and 70% DAU/MAU generally indicate a great and healthy product, but digging deeper may reveal problems or opportunities.
- Truly understanding the value of a metric. Every metric gives you information, but this information may not be relevant to the question at hand and may not be incremental to your understanding. However, that does not make the metric unilaterally useless. Before disregarding any metric, it is important to assess its relevance, scope and utility. For example, the quick ratio metric is valuable for understanding net growth, but it cannot tell you if that growth is sustainable. Storytelling illuminates the utility of a metric.
- Data is a manifestation of the story. A deep understanding of phenomena helps improve decision making, and constructing accurate narratives drives that deep understanding. To construct product stories, metrics and data are put together like so many puzzle pieces to tell a story. When data is examined without being linked by storytelling, the data can only provide an incomplete and perhaps inaccurate picture.
- More influence and better decision making. Stories are the means by which data scientists influence a diverse set of product stakeholders and produce better outcomes. Data alone can be forgotten, but a good story is readily recalled.
Dos and Don’ts
- Avoiding blanket statements. Often we use rubrics, things like 50% monthly retention is great or a quick ratio of greater than three is fantastic. Without the additional context provided by constructing a story, these statements can be misleading. For example, 50% monthly retention maybe great for an e-commerce product, but it may be terrible for a social product. One size does not fit all.
- Influence by stories and not numbers. Focus on telling stories and not narrating numbers and metrics. “DAU/WAU is 71%” and “people open the product five days of the week” are technically the same. However, the latter helps you create an arc of a story much more easily than the former. The former leads to a “data dump” and will only appeal to a small group of people. Avoid “data dumps” as much as possible and focus on creating the arc of a story.
- Data should ultimately lead to action. The primary role of a data scientist is to improve improved decision making using data. Storytelling plays an integral part in generating actions. Figure 6 shows the process by which numbers ultimately lead to stories, decisions and actions.

TAKEAWAYS
Storytelling is a powerful technique in data-informed product building, one that provides a deep understanding of what is happening with a product. A product’s story informs its goals, roadmap and strategy.
The flow of a story helps connect different pieces of information. In order to identify the different pieces, a combination of hypothesis-based and data-driven techniques is needed.
This work, which is a product of Sequoia Capital’s Data Science team, was previously published on Medium here. Please email data-science@siteadmin.peakxv.com with questions and comments.