The Evolution of Observability
Observability in 2030 will be far more advanced, intelligent, automated, and unified than it is today. Here are four trends that we think shape the future of this category.
By Harshjit Sethi, Sidhant Goyal and Mayank Porwal
Published October 10, 2022

Modern healthcare has mastered observability for the human body. When we fall ill, there are a bevy of technologies that physicians put to work to diagnose and treat our condition. A broken bone? An x-ray will indicate precisely where. An internal injury? An MRI will furnish the next level of detail. Irregular heartbeat? An ECG will quickly shed light on the matter.
The definition of observability, in any system, is the ability to measure its internal state by examining the output of associated sensors. Over time, healthcare has developed a nuanced ability to predict and know the internal state of the human body from external measurements of various kinds.
Software isn’t dissimilar. At the end of the day, software systems boil down to interconnected racks of servers and storage units, each operating distinct codebases and hosting various data stores. Two decades ago, all of the servers and almost the entire codebase belonged to the software company in question. Now, the servers are outsourced to public cloud vendors and the majority of the codebase running on these servers is third party, typically in the form of open source code or managed cloud services, with only a small but critical segment of the codebase written by the company governing the application’s core business logic. Building software today is very much like building a car or an airplane – parts can be manufactured and managed per spec by third parties – the key is the design and the assembly of the disparate parts to create a functional whole.
And so, observability for software systems boils down to observing the performance of each of the underlying components in play at a granular level – from managed services to physical servers / containers to code and configuration – while understanding their many interconnections and data/communication flows.
Looking back
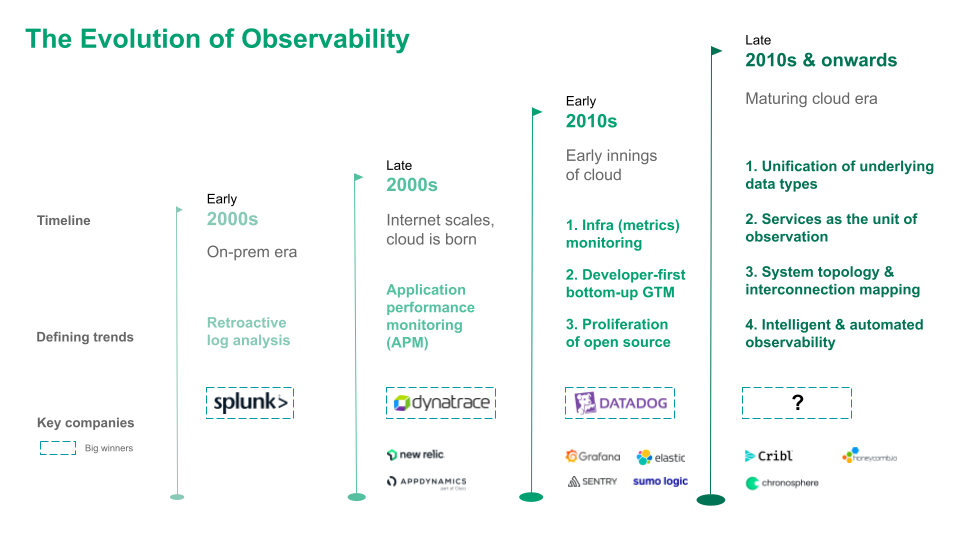
The evolution of software systems observability and the emergence of legendary companies has broadly corresponded to the key technological shifts. In the on-prem era, Internet traffic was relatively low, servers were relatively few, and the logs they generated (typically semi/un-structured lines of text recording actions or events within an application/server) could be directly analyzed to know the state of the system at any point, be it deep-diving into faults and errors or analyzing security incidents. Splunk emerged as an early winner, becoming the default retroactive log analytics platform in the enterprise both for observability and security, weaving its way to multi-billion dollar revenues. Elastic followed suit: what started off as an open source search engine found the meat of its application in log analytics, and eventually emerged as a worthy competitor to Splunk on the back of widespread bottom-up adoption. As Internet applications became commonplace and user traffic grew manifold, user experience gained mindshare and the concept of Application Performance Monitoring (APM) grew in significance. Companies such as AppDynamics, Dynatrace, and New Relic emerged to serve this need and ended up as public market giants or rich strategic acquisitions.
The transition to the cloud saw a significant shift in the observability landscape – it became more feasible to use time-series metrics such as CPU utilization, disk I/O, resource availability, etc., to monitor servers and managed services in the cloud and hence view the performance of the system in aggregate, while using logs to deep dive into critical issues unearthed by monitoring metrics. Players such as Datadog seamlessly executed a multi-product strategy using monitoring as the wedge to build one of the defining software infrastructure companies of the last decade.
Recent innovations have also been manifold: (1) Grafana developed an open source and highly customizable visualization layer with incredible bottom-up adoption, using this as a wedge to expand into the ‘unified observability’, i.e., metrics, logs and traces under one roof. Their effective ownership of the default OSS time series metrics database, Prometheus, has become strategic over time. (2) Cribl and Chronosphere used cost control and superior performance for logs and metrics databases respectively by optimizing data ingestion, as a powerful wedge into making a broader play in observability. (3) Sentry used application error monitoring as the wedge to create a developer-first APM. (4) Tracing has green shoots with OSS projects like Jaeger as well as companies like Lightstep (recently acquired by ServiceNow).
What’s next?
History is a great teacher, and we expect the future of observability to be dictated by the several key technological and mindset shifts currently underway. More precisely, we expect observability companies of this decade to incorporate the following four elements:
Services, not servers, as the unit of observation.
As the digital world embraces the microservices architecture, the performance and availability of a service, whether internal or third party, becomes the key driver and first point of reference in the analysis of the performance of the system. To frame the argument in another way, the performance and availability of an individual server or container, the current unit of observation, matters if and only if the performance and availability of the service they support is impacted. The elevation of services to a first-class citizen of observability might become an effective prerequisite to success.
Unification of underlying data types.
Until recently, most vendors specialized in one or more of the three core data types – metrics, logs, and traces. True observability implies the need to know the state of the system at any point in time, and the use of disparate solutions in each segment makes this hard for engineers. Most vendors such as Datadog, Splunk, Elastic, and Grafana have made a major push in this direction in the past few years and many CTOs indicate the need to consolidate their observability data into a single platform. This trend will only gain momentum over time.
Real-time mapping of system topology & interconnections.
Like any other system, the components of a software system work in tandem, constantly communicating and exchanging data to keep the user facing services and applications up and running. However, most observability tools today view components in isolation, with relatively limited knowledge of how the errors and failures in a single component cascade through the system, eventually causing system or service level failure / downtime. This makes root cause analysis of incidents especially difficult. We view tracing as an attempt to understand system interconnections via the propagation of a sampled set of failed requests through the system, to precisely understand ‘what went wrong, and where’. The application of graph technology to this problem statement holds promise: by mapping the dynamic and ever changing interconnections in software infrastructure in real time, it may enable engineers to develop a shared mental model of the system. A few startups have been building in this direction, most notably our Sequoia India portfolio company Last9.io with a very interesting product called Compass. We think that the ability to estimate the cascading impact of failures by understanding the networks between components will be a key wave of innovation in observability.
Intelligence and automation in observability.
The bane of an on-call engineer’s life is alert fatigue – driven by the countless times they have been awoken at 3am by a Pagerduty alert for an incident that turns out to be a false positive! Static, threshold-based alerting continues to be the norm and there is scope for the application of ML algorithms to identify with a degree of confidence truly anomalous events with the ability to bring down entire systems, versus the noisy spikes in certain metrics that eventually have no tangible or long-lasting impact on system performance. This is just one instance of innovation that can be and is being undertaken to reduce the cognitive burden on the DevOps engineers, infrastructure engineers, and SREs who are the guardians of system observability, and we expect this to be a significant trend in the next 10 years.
Builders, give us a shout!
This is a fascinating time to be a builder in software systems observability with innovation in the space at an all-time high, driven by the ever-growing complexity of the software tech stack, and the rich pools of talent working at Internet companies operating at planetscale. Our observations regarding the possible future directions of growth are just the tip of the iceberg. Observability in 2030 will be far more advanced, intelligent, automated, and unified than it is today, and we are excited to partner with founders who are driving its evolution.